
by Clarity by Rego
Share

If you’re just starting a business or you’re new to metrics, it may be difficult to understand which key performance indicators (KPIs) and performance measurements your organization should track. Having clear ideas on where to start — and what matters — helps set you up for success. Here’s a general guide to business metrics, what they mean, and which ones matter.
What Is a Metric?
A metric is a set of measurements used to monitor data and evaluate the success and/or outcomes of that data. “Metric” is an umbrella term for tracking progress in an organization. For example, a KPI is a type of metric. This data helps you watch areas of interest, such as the sales cycle, lead volume, inventory stockouts, profit margins, and more.
In other words, metrics help every part of your organization understand what’s happening and predict what will happen.
Metrics help you measure success.
Why Do They Matter?
Metrics convey the health of the organization, departments, processes, etc. They indicate risks, and they can help your organization save money, increase efficiency, improve effectiveness, and stay competitive.
Metrics help you track progress and make informed decisions that impact your organization and its employees.
What’s the Difference Between Metrics, KPIs, and OKRs?
Under the umbrella of business metrics, there are performance metrics, key performance indicators (KPIs), and objectives and key results (OKRs).
Performance metrics focus on accomplishing and executing on objectives. These metrics are generally consistent across industries and products. They help describe the organization’s current situation.
Where are we today?
KPIs and OKRs focus on future outcomes. These metrics are designed to move the organization toward long-term strategic goals. These future-focused metrics should be based on where the organization wants to be — not just where it currently is.
For more information, read Clarity by Rego’s Mastering OKRs.
Where will we end up?
What’s the Difference Between Quantitative and Qualitative Metrics?
Both qualitative and quantitative metrics help determine where your organization currently is and where it’s going.
Quantitative metrics are number-based. These include data points like how many customers you have, the number of employees, website visits, or calls received last Tuesday.
Quantitative metrics focus on how many.
Qualitative metrics tell a story and don’t involve numbers. These metrics include end-user feedback, employee engagement forms, and written customer surveys. These metrics often require more interpretation.
Qualitative metrics focus on why.
Use these two together. For instance, if 90% of your customers submitted feedback (quantitative), and the feedback is positive (qualitative), that indicates your customers are most likely satisfied.
What’s the Difference Between Leading and Lagging Metrics?
You might also hear the terms leading and lagging metrics. Like qualitative and quantitative metrics, they help assess overall success.
Leading metrics look toward the future and help predict outcomes or show trends.
Lagging metrics assess performance based on past results and outcomes.
Categories
In addition to the above types of metrics, Rego Consulting classifies them into three categories: business, process, and investment. These classifications help offer a full view of organizational health.
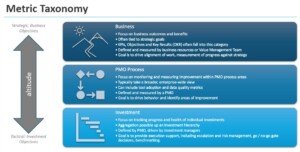
Business-based Metrics
Business-based metrics align with strategic goals and are often shared at the leadership level. For smaller companies with less formal structures, metrics may be more transparent with more people giving insight. If it’s a public company, top-level metrics are shared with shareholders and the media during earnings calls.
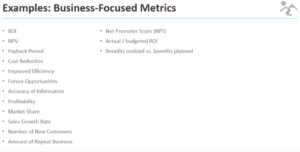
Examples
- ROI
- MPV
- Payback Period
- Cost Reduction
- Efficiency Improvements
- Profitability
- Market Share
- Sales Growth
- Customer Acquisition
- Net Promoter Score (NPS)
- Actual vs. Budget ROI
- Benefits Realized vs. Benefits Planned
Process-based Metrics
Process-based metrics track the efficiency and effectiveness of processes and may be more operational in nature. Typically, Project Management Office (PMO) employees review these and share results with impacted departments. These metrics may not indicate the direct health of your organization, but they impact it. For example, if your organization doesn’t manage resources well, you may have higher expenses and decreased profits.
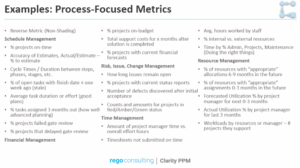
Examples
- Schedule Management
- Financial Management
- Risk, Issue, and Change Management
- Time Management
- Resource Allocation
Investment-based Metrics
Investment-based metrics evaluate the health and performance of individual investments — such as new departments, technologies, and programs. These factors help organizations know whether to continue with an investment and potentially stop spending money. For example, if a department – Inside Sales – is newly created, but has been ineffective at reaching its business goals, the organization may decide to stop investing. Anyone in the organization can use them.
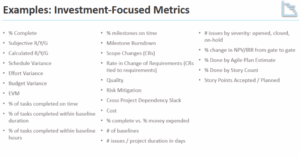
Examples
- Percentage Complete
- Budget Variance
- Quality
- Risk Mitigation
- Burn Rate
Agile Metrics
Agile metrics are those measurements from projects, typically software development ones, that focus on output. These measurements, and how teams handle them, are iterative and call for teams to be flexible, adjusting as needed.
It’s important to collect the measurements that are timely and visible, especially related to process. These metrics can help your organization adapt quickly.
Examples
- Throughput
- Lead Time
- Cumulative Defect Trend
- Epic Lead Time Ratio
- Turnaround Time
For more information about agile metrics, view our webinar.
Best Practices
Now that you’re familiar with the types of metrics and categories, here are some best practices to consider when selecting measurements to track in your organization:
- What matters to your organization? (What makes you competitive?)
- What matters to your industry?
- Where do you get the metrics, and can you get them consistently?
- What’s the baseline?
- What’s the target?
- What’s the frequency?
- Can you make decisions based on these metrics?
You’ll also want a healthy mix of these measurements — leading and lagging, qualitative and quantitative, business-based, process-based, and business-based.
Keep It Simple, Silly (KISS)
Metrics should be clear, simple, and actionable. Overly complex measurements that don’t impact your organization or help you understand what’s happening aren’t worth tracking.
Avoid Tying Metrics to Salaries
While teams should be accountable for what’s being measured, tying these measurements to salary may discourage honest reporting and hurt transparency. Instead, use bonuses or incentives when employees provide metrics, especially when negative results are improved.
Look at the Whole Story
No single metric provides the full picture. Look at all of them holistically. For example, if profit is up but your Net Promoter Score (NPS) is down, that might signal temporary success but long-term risk. (Are your prices too high?)
Together, all your metrics tell a story.
Communication
There’s an old business saying: “Manage what you measure.” But you can’t manage anything without a clear communication plan. Your communication of measurement is just as important as the metrics themselves.
- Who needs which metrics and why?
- Can they be transparent?
- How are metrics provided and by whom?
- Who can act on the data?
- How and when are changes made based on metrics?
Consider using tools like a RACI matrix to define roles. RACI stands for Responsible, Accountable, Consulted, Informed. This matrix may aid you in deciding who needs to know what.
Change Management
Sometimes measurements reveal big changes — like poor financial performance. They can lead to cutbacks or restructuring. That’s why change management is critical when interpreting and acting on data. Consider how these changes affect people, products, and services.
Issues and How to Fix Them
Warning: Some metrics may need to be retired.
Metrics can be irrelevant and useless … not to mention irritating! Review measurements and data regularly. Most metrics deserve at least a quarterly review.
After reviewing regularly, decide whether those measurements are working for your organization. Here are a few issues that arise when metrics have “gone bad” and generally, how to resolve those problems.
Aren’t Accurate
When metrics are outdated or wrong, it may be that your software system(s) or teams can’t understand them. Keep an open dialog with your team; the more they understand these measurements, the more accurate they will be. Also, you may want to consider investing in better software.
Employees Are Reluctant to Share
No one likes giving bad news, especially if they believe they’ll get in trouble. Instead, ask employees to treat issues as opportunities with a focus on resolving problems. If metrics are everyone’s responsibility, and no one is punished, undoubtedly more people will be transparent and work together to fix issues. As noted above, consider offering incentives for raising and resolving issues.
Never Reviewed
If particular measurements are never reviewed, they probably don’t matter or don’t affect the business. Let irrelevant metrics die. But, before you do, ensure they don’t impact the business!
Aren’t Actionable
The organization needs metrics to make decisions. If they’re not using specific metrics for decisions, maybe those measurements don’t matter. Or maybe employees don’t have the time and resources to make those changes.
Bottom Line on Metrics
At the end of the day, what matters most about metrics is what you’re measuring and how those measurements impact your organization.
- Can you use your data to make decisions and positive changes?
- Is your data useful?
- Do you look at the whole picture?
- Does it help you understand where you are and where you’re headed?
Successful organizations have:
- The right level of transparency
- The right people and tools, including software
- A solid communication and change management plan
- A full view across all measurements with regular discussion
Ready to learn more? Check out Rego’s Metrics and KPIs webinar.
Let Rego Be Your Guide
At Rego Consulting, we offer Clarity by Rego. Clarity by Rego is project portfolio management software, perfect for small and midsized businesses. Clarity by Rego is brought to you by the experts who know project portfolio management better than anyone else in the industry: Rego Consulting. Since 2007, the Rego team has been customizing solutions for leading Fortune 100 companies. As strategic advisors to more than 800 companies — and counting — we’ve learned a thing or two. Interested? Take a tour or get a free trial.
More than having the right software for project management, Rego also has experienced consultants who can help you identify the most valuable metrics for your organization. Our more than 200 guides have decades of experience helping organizations gain actionable insights and measure what truly matters.

STAY IN THE LOOP
Get Notified of Updates.
Stay ahead of the curve by subscribing to our newsletter. Get the latest insights, strategies, and tools delivered straight to your inbox, and empower your business to achieve more.
