Streamline Financial Planning for Every Project
Bring budgets, forecasts, and resources together for a clear view of your financial health across projects. Clarity adapts to your needs, ensuring every dollar is allocated effectively. Help your teams focus on delivering value while keeping finances on track.
Know where your money is going
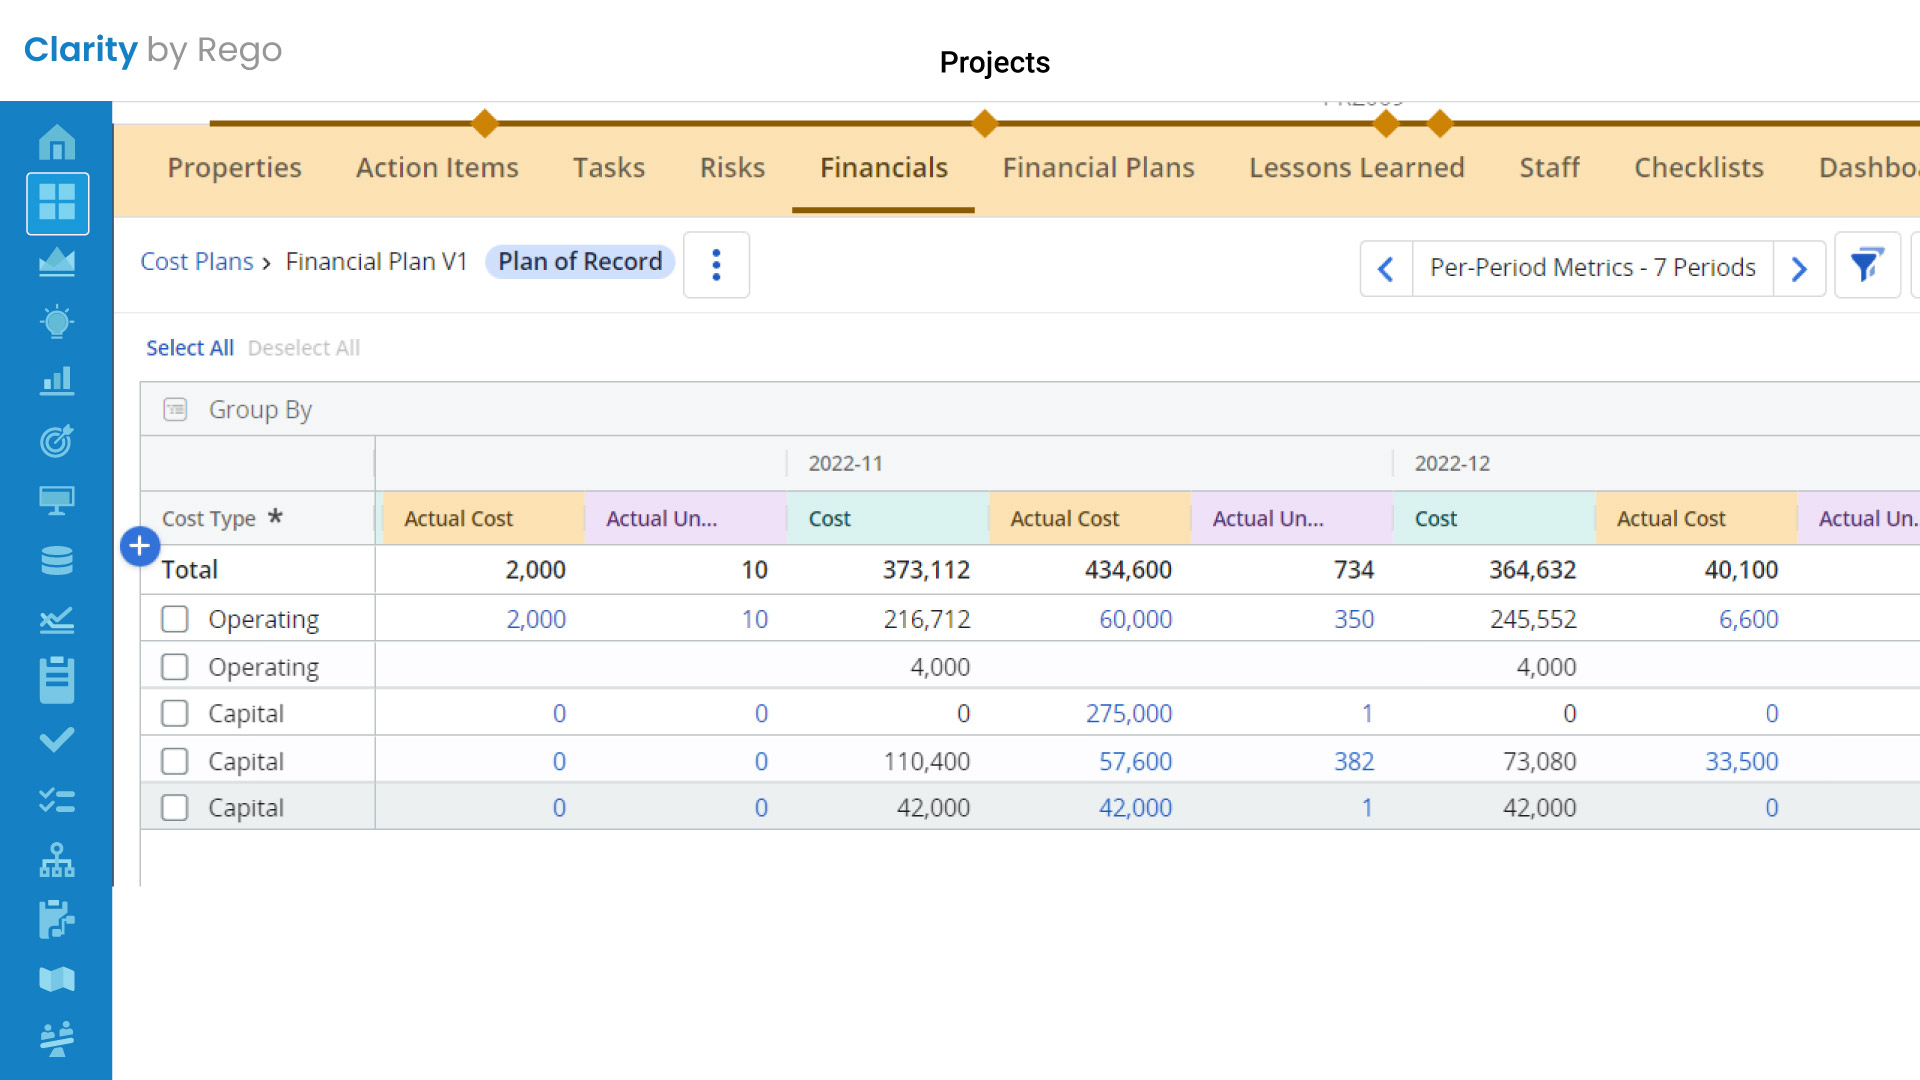
Roll up financials across projects to track spending and share with leadership to enhance decision-making and inform planning. Create what-if scenarios to model the effects of any budget changes you’re considering.
Align projects and costs in one place
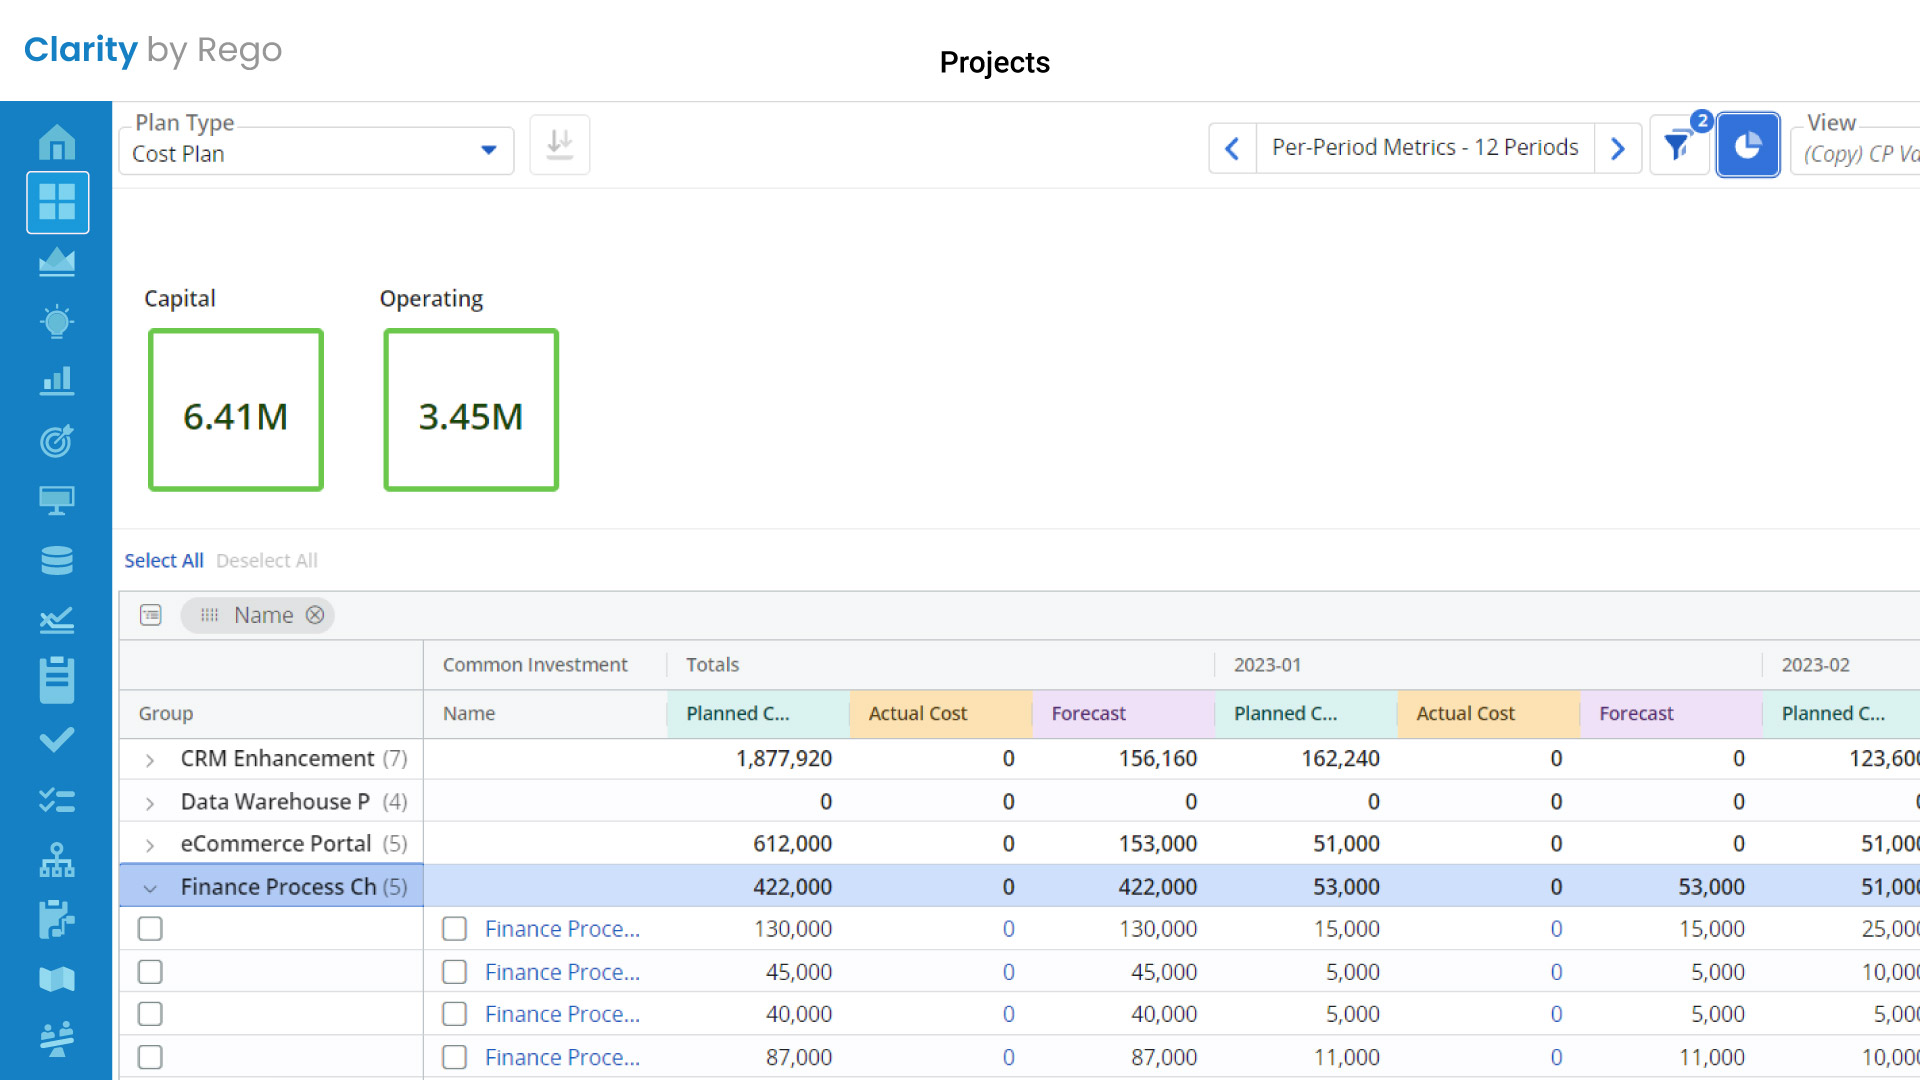
Manage financial and project data in one place to stay organized and simplify budgeting and forecasting. With unlimited auditable versions and targeted views, users only see the information they need.
Make your spending count
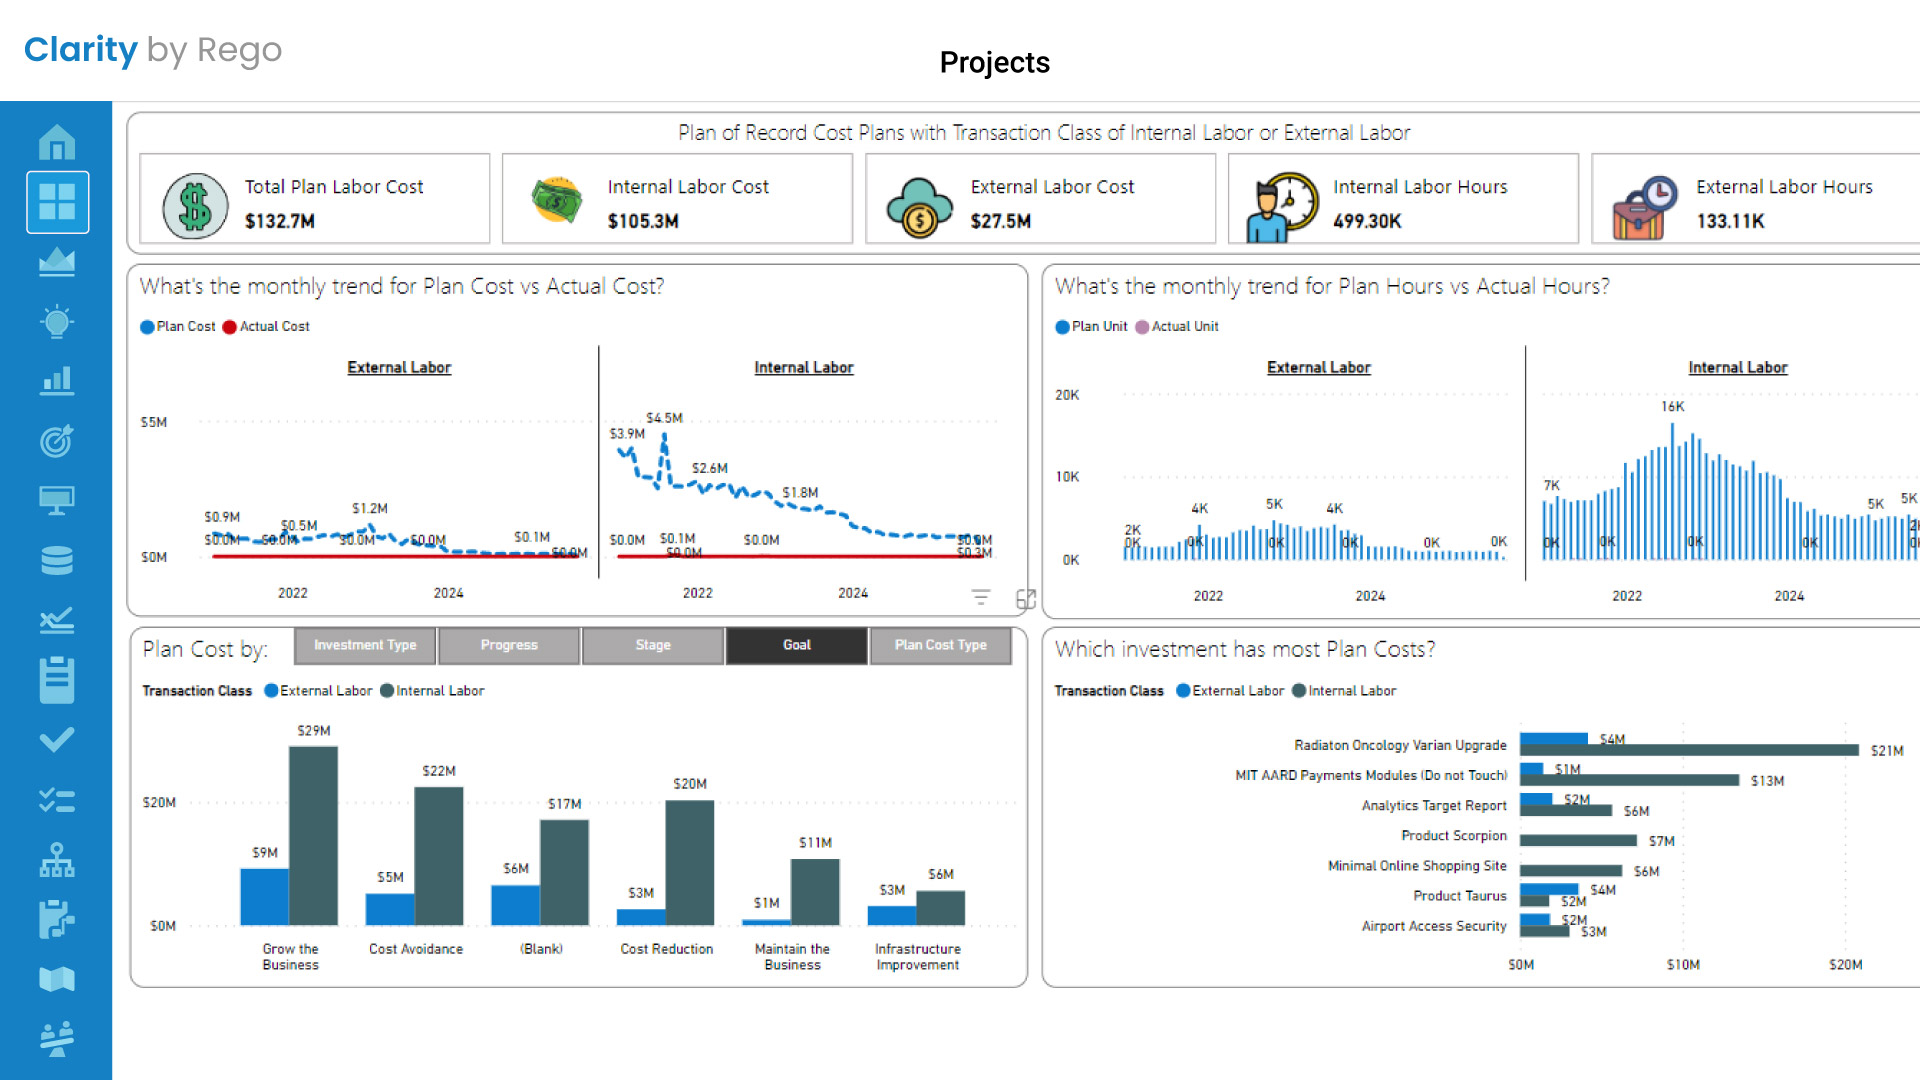
Gain visibility into spend on each project to analyze financial performance, identify capitalizable expenses, and prepare auditable reports. Use real-time insight into financial plans, trends, and forecasts to make better decisions and optimize results.
Eliminate tedious manual reporting
Auto-generate financial reports and customize for different audiences or export to applications like Power BI for deeper analysis. Give everyone the financial data they need—in their preferred format—and the power to create on-demand reports to get the answers they require in real-time.
Capitalize on your financial information
Optimize performance with financial clarity. Whatever insights you need, Clarity can help.
Scenarios
See the outcomes of business decisions before you make them. Build what-if scenarios for different combinations of initiatives and budget changes to assess your options and make better decisions.
Reporting
Use pre-built Power BI reports or customize by project, configure for different users, share across teams, and auto-create financial reports to eliminate manual work and keep everyone informed.
Integrations
Analyze financials your way. Connect with an array of popular reporting and enterprise applications—including Tableau, PowerBI, Click, Congos, Blocker, and most BI software—or export to Excel.
OKRs
Align work in progress to top-line organizational OKRs—measure and report on progress toward objectives to keep stakeholders informed.
Timesheets
Assess time and resources allocated to projects to inform financial reporting, annual planning, and update executives. Timesheets are iterative, with version and editing history available for auditing—route approvals to anyone or no one, auto-approve, or sign-off via email.
Target Planning
Measure roadmap projects against important target metrics and see how changes would affect your plan. Customize priority scoring criteria, weight values, and sort by rank.
Portfolio Overview
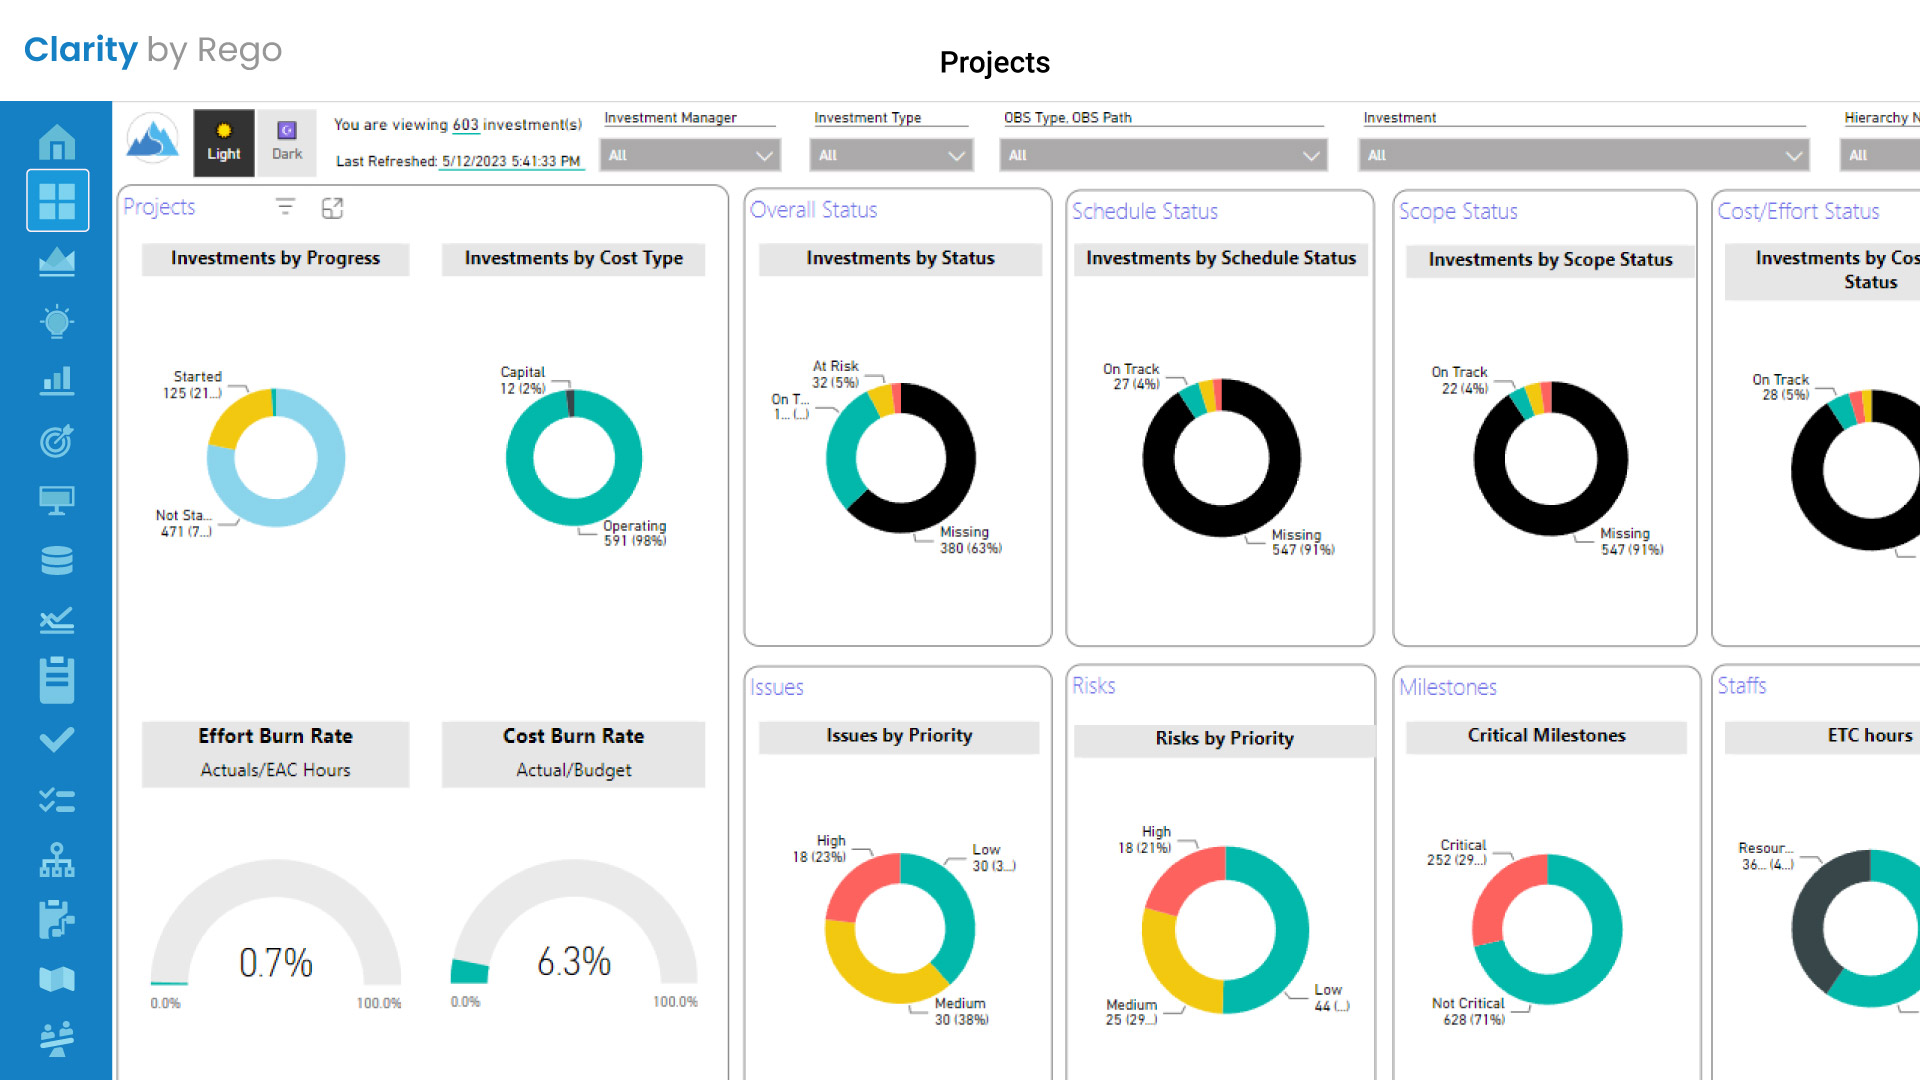
Roll up financial data across your projects to monitor portfolio progress by segment. Dig into individual projects to identify and address issues.
Dashboards
Monitor project progress in real-time. Customize views to track specific information and share across users for easy collaboration.
Tasks
Organize and prioritize your work with task views that include list, grid, timeline, Kanban board, and Gantt chart.
Action Item Responder
Simplify collaboration with executives and across departments by empowering users to triage workflows, timesheets, approvals, and more by responding directly from email—without having to log in and check a box.
